Methodology · Framework v2
How the Crisis Signal Index is built and read
CSI is a structured, repeatable assessment of global systemic risk. The weekly reading is not a model left to run on its own: every published reading is assembled from defined indicators, supported by reviewed evidence, and signed off by an analyst. A clearly-labelled model-generated outlook accompanies it — a probabilistic estimate with stated uncertainty, built and calibrated as described below.
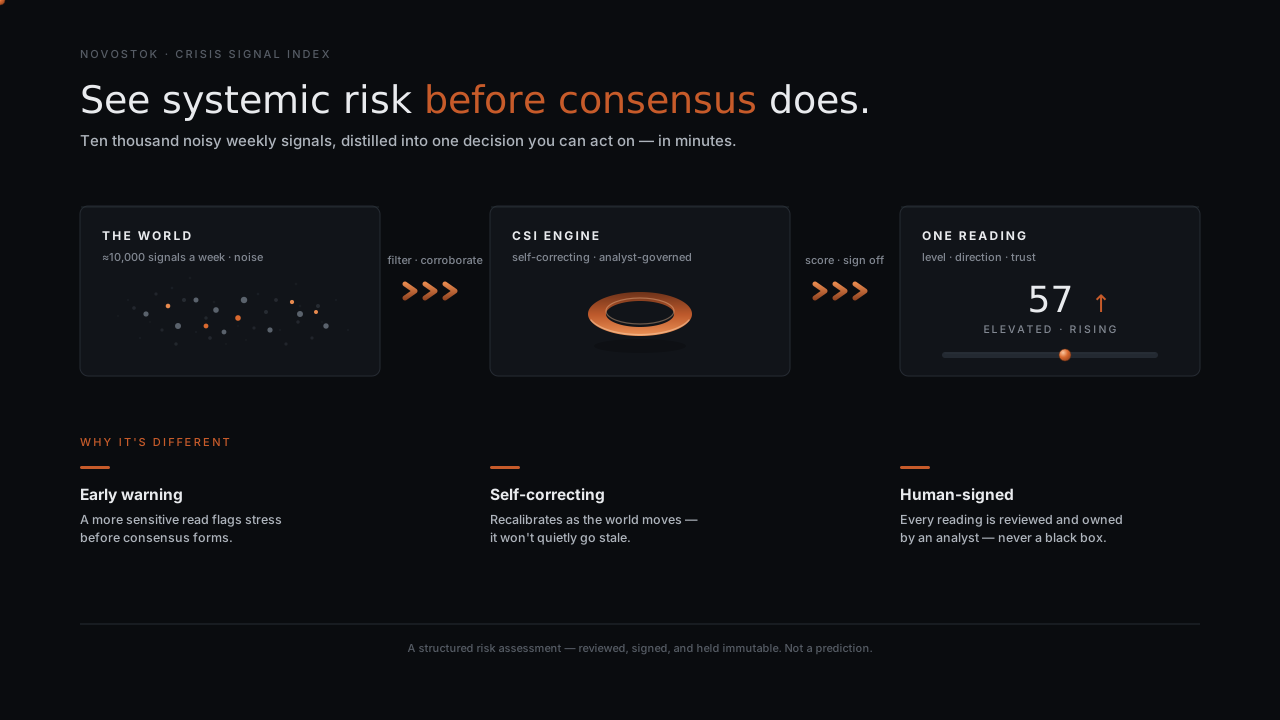
For a one-page executive overview — how this works and what makes it different — see the architecture overview.
Regime bands
A reading is mapped to a named regime by its CSI-S value. The bands give the numbers context — they answer “where are we, and how close are we to crossing a threshold?”
| Regime | CSI-S range | Meaning |
|---|---|---|
| Stable | 0 – 40 | Conditions are broadly orderly; stress is contained. |
| Elevated Stress | 40 – 60 | Visible strain in one or more systems; not yet systemic. |
| Managed Instability | 60 – 75 | Serious, active stress being actively managed by authorities. |
| Intervention Risk | 75 – 85 | Stress approaching the point where extraordinary intervention is likely. |
| Declared Systemic Crisis | 85 – 100 | Open, confirmed systemic crisis. |
Two safeguards protect the reading: confirmed crisis-plumbing stress can raise the regime floor regardless of the headline number, and a sharp divergence between the sensitive and conservative reads is surfaced explicitly rather than averaged away.
A deliberately dual index
CSI reports two readings rather than one. CSI-C (Conservative) is the cautious assessment — it minimises false alarms and is the right anchor for high-cost, hard-to-reverse commitments. CSI-S (Sensitive) prioritises early warning and is built for contingency planning and monitoring. The gap between them is itself information.
The Consensus Gap (CSI-S minus CSI-C) measures how much the sensitive and conservative reads disagree. A widening gap typically precedes regime transitions and signals rising uncertainty about the environment.
What the index measures
The reading is built from ten indicators across four domains — geopolitics and geoeconomy, conflict, economy and markets, and systemic resilience. Each indicator is scored against published guidance, weighted, and combined into the two headline readings.
Weighting is applied at the indicator (transmission-channel) level. Indicators carry differentiated weights reflecting their significance to crisis momentum — structural drivers weigh more heavily than early-warning thermometers, rather than contributing equally. The four domains are descriptive groupings, not equal-weighted baskets. Premium subscribers see each indicator's weight in the dashboard breakdown and the weekly report; it is the calibration behind those weights — how they are tuned against our historical reconstruction — that we keep proprietary, not the weights themselves.
Evidence confidence and confirmed transmission
Evidence confidence measures the evidentiary strength behind a reading. It separates three questions that are easy to blur: how far we trust what we are seeing (source quality), how completely we have observed what actually defines each indicator (coverage), and how independently the finding is corroborated. A reading is only as strong as the weakest of the three — thin coverage or single-source evidence holds confidence down even when the source is impeccable. Some indicators can be read directly from public, authoritative data; others are structurally harder to observe — and where that is the case the index lowers its confidence and says so, rather than presenting a thin reading as a firm one. A low-confidence reading is treated as provisional. This is confidence in the assessment process, not predictive confidence and not advice.
The CTI (Confirmed Transmission Index) tracks seven hard, observable plumbing signals — repo stress, swap-line usage, emergency liquidity, bank failures, deposit flight, market dysfunction and extraordinary policy action. It indicates whether elevated stress has been confirmed as broad transmission across systems, rather than remaining confined to sentiment. It is a confirmation measure — not a prediction, and not a declaration of crisis.
Momentum
Momentum reports the change in the reading over the trailing four weeks — the direction of travel. It answers “are we deteriorating, stable, or improving?” independently of the absolute level.
The outlook (model-generated forecast)
Each published reading is accompanied by a 4–6 week outlook: a central projection for CSI-S and CSI-C with uncertainty bands. It is generated by a deliberately simple, fully transparent statistical model — damped-trend exponential smoothing fitted to the published weekly history. Damping makes the projection flatten as the horizon extends: the further out, the less any current trend is extrapolated.
The uncertainty bands are empirical, not theoretical. The model is back-tested against the platform's own history — fit on the past, forecast ahead, compare with what actually happened — and the 68% and 90% bands are cut from the distribution of its real errors at each horizon. If the index proves harder to predict four weeks out, the four-week band widens by itself. Every published outlook is stored immutably, so accuracy is continuously re-measured against reality as weeks resolve.
The bands are the message: near-term estimates are stronger, and confidence deliberately fades with distance. The outlook assumes continuity — it cannot foresee shocks, and a genuine surprise will land outside the bands. It is a probabilistic estimate, not a promise: read the band, not the line.
Outlooks are generated deterministically when a reading is published, versioned with the model that produced them, and never revised afterwards. They are a presentation output derived from published history only — they never feed back into scoring, and the analyst-governed reading remains the platform's judgment.
How evidence is gathered
CSI is organised around what each indicator requires to be observed, not around a fixed list of sources. When an indicator is under-observed in a given week, effort is directed at closing that gap — including looking beyond the usual sources — so that coverage follows what the reading actually needs.
Evidence for each indicator is drawn from multiple independent surfaces — official and authoritative data, primary statements, and credible reporting — rather than any single feed. A signal only strengthens a reading when it is independently corroborated: the same claim repeated across outlets that echo one another is not treated as confirmation. Where an indicator cannot be adequately observed in a given week, that gap is carried into the evidence-confidence reading rather than filled with assumption.
Before anything is scored, related evidence is grouped into the underlying real-world developments it describes, so the analyst reviews a handful of corroborated developments rather than hundreds of separate items — with corroboration measured across genuinely independent lines of evidence, not raw counts.
Keeping the lens honest
Two failure modes are designed against explicitly. The echo chamber: repetition is not confirmation, so the same claim echoed across outlets that cite one another counts once, and independent corroboration is weighted above volume — a source's standing never substitutes for an independent check. And drift: a fixed lens slowly stops matching a changing world, so CSI continually re-examines whether its sources still cover what each indicator requires, rather than narrowing into a comfortable view.
A human-governed process
CSI is explicitly human-in-the-loop. Automated tooling may gather and propose evidence, but it never sets scores, never approves its own sources, and never publishes. Scoring uses only analyst-approved signals; every published reading and report is reviewed and released by a person and is then immutable. The platform is an analyst-governed assessment, not an unsupervised prediction engine. The scoring methodology described here remains version 1.0; what continues to be strengthened is how evidence is gathered, corroborated and confidence-rated beneath it. The indicator weights themselves are shown to Premium subscribers; beyond them, the exact thresholds and the rules that govern where the engine searches are calibrated against our reconstructed history and kept proprietary — what we publish is how the system reasons, not the parameters it is tuned with.
Historical baseline & limitations
Readings before the live-publication boundary are a reconstructed historical baseline, estimated under the methodology in force at the time from available source data; they were not published live then and are labelled as such. The framework was revised to Framework v2 — a ten-indicator taxonomy — from the v2 transition onward. CSI is a structured risk assessment, not a prediction, and does not constitute investment, legal, tax, financial or security advice. Users remain responsible for their own decisions.